Lab preparation
Creating a version-controlled R-Project with Github
Download repository here: https://github.com/garberadamc/SEM-Lab4
On the Github repository webpage:
forkyour ownbranchof the lab repository- copy the repository web URL address from the
clone or downloadmenu
Within R-Studio:
- click “NEW PROJECT”
- choose option
Version Control - choose option
Git - paste the repository web URL path copied from the
clone or downloadmenu on Github page - choose location of the R-Project (too many nested folders will result in filepath error)
Load packages
Upload list of mplus.R functions
http://www.statmodel.com/mplus-R/mplus.R
## [1] "Loaded rhdf5 package"Lab outline
- Run a simple moderation model with binary moderator (re-coded)
- Plot simple slopes with
ggplotusing data extracted fromgh5file produced by Mplus output - Run a parallel model with interaction between two continuous variables
- Estimate a conditional mediation model with the
teamsdata
Data sources:
Models are adapted to demonstrate moderation and conditional mediation effects:
- The first two examples utilize the Vocabulary and Education dataset from the National Opinion Research Center General Social Survey. GSS Cumulative Datafile 1972-2016 (Fox, 2008) \(\color{blue}{\text{See documentation here}}\)
To see metadata run - ?carData::Vocab
- The third example is from chapter 3 of the book, Regression and mediation analysis using Mplus, by Muthen et al., 2017. The dataset is called
teamsand is from a study about automobile parts work teams (Cole et al., 2008). This model is also discussed in the Hayes (2013) book on mediation.
Read the Vocab dataframe into your R-environment from package {carData}
data(Vocab)
vocab <- as.data.frame(Vocab) %>% mutate(year_new = year - 1973)
vocab2 <- vocab %>% filter(year %in% c(1974, 2016)) %>% mutate(year = droplevels(factor(year)))Starting with a familiar example
| Name | Labels |
|---|---|
| year | Year of the survey (1974 - 2016) |
| sex | Sex of the respondent (Female or Male) |
| education | Students education in years |
| vocabulary | Vocabulary test score: number correct on a 10-word test |

\[ \color{red}{\text{vocabulary}} = \alpha + \beta_{1}(\color{blue}{\text{year}}) + \beta_{2}(\color{green}{\text{education}}) + \beta_{3}(\color{blue}{\text{year}} \times \color{green}{\text{education}}) + \epsilon \]
Model 1: Run moderation with binary moderator variable year
m1_lev2mod <- mplusObject(
TITLE = "m5 model indirect - Lab 3",
VARIABLE =
"usevar =
year education vocabulary int_yred; ",
DEFINE =
"!center education (grandmean); ! leave un-centered for plot
int_yred = year*education; ! create interaction term ",
ANALYSIS =
"estimator = MLR" ,
MODEL =
"[vocabulary](b0);
vocabulary on
year(b1)
education(b2)
int_yred(b3); " ,
MODELCONSTRAINT =
"LOOP(x,6.62,19.18,0.01); # 2SD above/below mean
PLOT(y1974 y2016);
y1974 = b0 + b2*x;
y2016 = b0 + b1 + (b2+b3)*x;
new(hi_y1974 lo_y1974 hi_y2016 lo_y2016 diff_hi);
hi_y1974 = b0 + b2*(6.28);
lo_y1974 = b0 + b2*(-6.28);
hi_y2016 = b0 + b1 + (b2 + b3)*(6.28);
lo_y2016 = b0 + b1 + (b2 + b3)*(-6.28);
diff_hi = hi_y2016 - hi_y1974; ",
OUTPUT = "sampstat standardized modindices (3.84)",
PLOT = "type=plot3;",
usevariables = colnames(vocab2),
rdata = vocab2)
m1_lev2mod_fit <- mplusModeler(m1_lev2mod,
dataout=here("mplus_files", "Lab5.dat"),
modelout=here("mplus_files", "m1_lev2mod_Lab5.inp"),
check=TRUE, run = TRUE, hashfilename = FALSE)Plotting using data extracted from gh5 files produced by Mplus
- View plots available for a given model
- Generate plots using the
get.plot.___function - Extract data and transform to tidy format
- Plot with
ggplot
Prepare plot data
loop_data <- lapply(1:2, function(k) {
y_val <- mplus.get.loop.estimates(here("mplus_files", "m1_lev2mod_Lab5.gh5"),
label = k)
lower <- mplus.get.loop.lowerci(here("mplus_files", "m1_lev2mod_Lab5.gh5"), label = k)
upper <- mplus.get.loop.upperci(here("mplus_files", "m1_lev2mod_Lab5.gh5"), label = k)
x_val <- mplus.get.loop.xvalues(here("mplus_files", "m1_lev2mod_Lab5.gh5"))
loop_data <- as.data.frame(cbind(y_val, x_val, lower, upper)) %>% mutate(group = factor(k))
})
plot_data <- bind_rows(loop_data)Plot simple slopes moderation with standard error ribbons
ggplot(plot_data, aes(x=x_val, y=y_val, #
group = group, #
color = group)) + #
geom_ribbon(aes(ymin = lower, ymax = upper), #
fill = "blue", alpha = .2, size = 0) + #
geom_line(size=.8) + #
scale_color_manual(values=c("darkblue", "magenta"), #
name = "Year", labels = c("1974", "2016")) + #
scale_x_continuous(breaks = c(seq(6,20,2))) + #
labs(y = "Vocabulary" , #
x = "Education (years)") + #
theme_ipsum() 
Save plot
Model 2: Run moderation with continuous moderator variable year (range: 1- 42)
m2_contmod <- mplusObject(
TITLE = "m5 model indirect - Lab 3",
VARIABLE =
"usevar =
year_new education vocabulary int_yred; ",
DEFINE =
"!center education (grandmean); ! leave un-centered for plot
int_yred = year_new*education; ! create interaction term ",
ANALYSIS =
"estimator = MLR" ,
MODEL =
"[vocabulary](b0);
vocabulary on
year_new(b1)
education(b2)
int_yred(b3); " ,
MODELCONSTRAINT =
"LOOP(x,6.62,19.18,0.01);
PLOT(y1974 y1984 y1995 y2005 y2016);
y1974 = b0 + b1*1 + b2*x + b3*x*1;
y1984 = b0 + b1*10 + b2*x + b3*x*10;
y1995 = b0 + b1*21 + b2*x + b3*x*21;
y2005 = b0 + b1*31 + b2*x + b3*x*31;
y2016 = b0 + b1*42 + b2*x + b3*x*42; ",
OUTPUT = "sampstat standardized modindices (3.84)",
PLOT = "type=plot3;",
usevariables = colnames(vocab),
rdata = vocab)
m2_contmod_fit <- mplusModeler(m2_contmod,
dataout=here("mplus_files", "Lab5.dat"),
modelout=here("mplus_files", "m2_contmod_Lab5.inp"),
check=TRUE, run = TRUE, hashfilename = FALSE)Prepare plot data
loop_data2 <- lapply(1:5, function(k) {
y_val <- mplus.get.loop.estimates(here("mplus_files", "m2_contmod_Lab5.gh5"),
label = k)
lower <- mplus.get.loop.lowerci(here("mplus_files", "m2_contmod_Lab5.gh5"), label = k)
upper <- mplus.get.loop.upperci(here("mplus_files", "m2_contmod_Lab5.gh5"), label = k)
x_val <- mplus.get.loop.xvalues(here("mplus_files", "m2_contmod_Lab5.gh5"))
loop_data2 <- as.data.frame(cbind(y_val, x_val, lower, upper)) %>% mutate(group = factor(k))
})
plot_data2 <- bind_rows(loop_data2)Plot simple slopes moderation plot with standard error bands
cont_plot <- ggplot(plot_data2, aes(x=x_val, y=y_val, #
group = group, color = as.numeric(group))) + #
geom_ribbon(aes(ymin = lower, ymax = upper), #
fill = "blue", alpha = .2, size = 0) + #
geom_line(size=.7) + #
scale_color_viridis_c(name = "Year", #
labels = c("1974", "1984", "1995", "2005", "2016")) + #
labs(y = "Vocabulary" , x = "Education (years)") + #
theme_ipsum()
# cont_plotSave plot
Create interactive plot with {ggplotly}
Conditional indirect effect model
This version of of moderated mediation is described as case 2 in the Muthen et al. (2016) text.
| Name | Labels |
|---|---|
| dysfunc (X) | Dysfunctional behavior of team members |
| negexp (Z) | Nonverbal negative expressibility between team members (measured by supervisor) |
| negtone (M) | Negative affective tone expressed by team members |
| perform (Y) | Team performance using measures of efficiency, timeliness, and objectives |

Read in data
Model 3: Estimate conditional indirect effect model
m3_teams <- mplusObject(
TITLE =
"Data source - Hayes (2013) TEAMS Case 2 moderation of M -> Y ",
VARIABLE =
"usevar = dysfunc negtone negexp perform mz;",
DEFINE =
"MZ = negtone*negexp; ! create interaction term ",
ANALYSIS =
"! set number of bootstrap draws (small # for demonstration purposes)
bootstrap = 500; " ,
MODEL =
"perform on negtone dysfunc negexp mz;
negtone on dysfunc;
Model indirect:
perform MOD
negtone negexp(-0.4,0.6,0.1) mz dysfunc(0.4038 0.035); ",
OUTPUT =
"sampstat standardized cinterval (bcbootstrap); ! bias-corrected bootstrap",
PLOT = "type=plot3;",
usevariables = colnames(teams),
rdata = teams)
m3_teams_fit <- mplusModeler(m3_teams,
dataout=here("mplus_files", "Lab5.dat"),
modelout=here("mplus_files", "m3_teams_Lab5.inp"),
check=TRUE, run = TRUE, hashfilename = FALSE)Model 3 Mplus output
TOTAL, INDIRECT, AND DIRECT EFFECTS BASED ON COUNTERFACTUALS (CAUSALLY-DEFINED EFFECTS)
Effects from DYSFUNC to PERFORM for NEGEXP = -0.100
Tot natural IE -0.088 0.045 -1.939 0.052
Pure natural DE 0.135 0.069 1.962 0.050
Total effect 0.047 0.071 0.664 0.507
Effects from DYSFUNC to PERFORM for NEGEXP = 0.000
Tot natural IE -0.100 0.045 -2.194 0.028
Pure natural DE 0.135 0.069 1.962 0.050
Total effect 0.035 0.073 0.488 0.626
Effects from DYSFUNC to PERFORM for NEGEXP = 0.100
Tot natural IE -0.111 0.047 -2.391 0.017
Pure natural DE 0.135 0.069 1.962 0.050
Total effect 0.024 0.075 0.316 0.752View available plots from the Mplus model
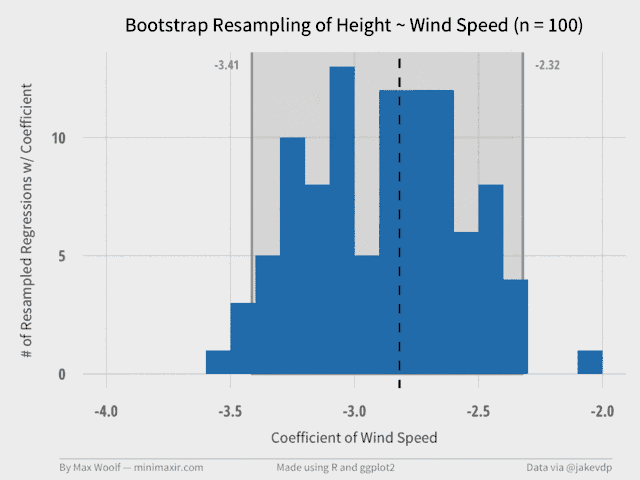
Take a look at bootstrap distribution of the indirect effect to view asymptotic shape.

Create an animation depicting draws of the bootstrap distribution with {gganimate}
x_draws <- mplus.get.bootstrap.distribution(here("mplus_files", "m3_teams_Lab5.gh5"), parameter = 38)
x_draws <- as.data.frame(sample(x_draws))
colnames(x_draws) <- c("x_val")
point_est <- mplus.get.bootstrap.point.estimate(here("mplus_files", "m3_teams_Lab5.gh5"), parameter = 38)
anim_plot5 <- ggplot() + #
geom_histogram(data=x_draws[1:10,], aes(x=x_val), alpha = .6, fill = "blue") + #
geom_histogram(data=x_draws[1:20,], aes(x=x_val), alpha = .8, fill = "lightblue") + #
geom_histogram(data=x_draws[1:40,], aes(x=x_val), alpha = .6, fill = "blue") + #
geom_histogram(data=x_draws[1:80,], aes(x=x_val), alpha = .8, fill = "lightblue") + #
geom_histogram(data=x_draws[1:160,], aes(x=x_val), alpha = .6, fill = "blue") + #
geom_histogram(data=x_draws[1:320,], aes(x=x_val), alpha = .8, fill = "lightblue") + #
geom_histogram(data=x_draws[1:500,], aes(x=x_val), alpha = .6, fill = "blue") + #
geom_vline(aes(xintercept = point_est), linetype = 1, size = 2, color = "red") + #
geom_errorbar(aes(y=25, x=point_est, xmin=-0.230, xmax=-0.037), #
col="black", size = 1.2) + #
transition_layers(layer_length = 5, transition_length = 1) + #
labs(x= "Indirect Effect", y="Count", Main = "Bootstrap Draws") + #
theme_minima
anim_plot5
anim_save(here("figures", "boot.gif"), dpi = "retina")To see animation of how the bootsrap distribution changes with increasing sample draws (N) go here: https://raw.githubusercontent.com/minimaxir/frames-to-gif-osx/master/examples/uni_frames.gif
Create plot of moderated direct and indirect effects
label <- c('Total natural DE', 'Total natural IE')
mod_data <- lapply(1:2, function(k) {
y_val <- mplus.get.moderation.estimates(here("mplus_files",
"m3_teams_Lab5.gh5"),label[k])
lower <- mplus.get.moderation.lowerci(here("mplus_files" ,
"m3_teams_Lab5.gh5"),label[k])
upper <- mplus.get.moderation.upperci(here("mplus_files" ,
"m3_teams_Lab5.gh5"),label[k])
x_val <- mplus.get.moderation.xvalues(here("mplus_files" ,
"m3_teams_Lab5.gh5"))
mod_data <- as.data.frame(cbind(y_val, x_val, lower, upper)) %>%
mutate(group = factor(k))
})
plot_data2 <- bind_rows(mod_data)
ggplot(plot_data2, #
aes(x=x_val, y=y_val, group = group, color = group, fill = group)) + #
geom_ribbon(aes(ymin = lower, ymax = upper), #
alpha = .2, size = 0, show.legend = FALSE) + #
geom_line(size=.8) + #
geom_hline(yintercept = 0, alpha =.8, linetype = 2) + #
scale_x_continuous(expand = c(0,0)) + #
scale_color_manual(values=c("darkblue", "magenta"), #
name = "", labels = c("Direct effect", "Indirect effect")) + #
labs(y = "Effect" , #
x = "Negative Expectations") + #
theme_minimal() 
Save plot
References
Brader T, Valentino NA, Suhat E (2008). What Triggers Public Opposition to Immigration? Anxiety, Group Cues, and Immigration. American Journal of Political Science, 52(4), 959–978.
Hallquist, M. N., & Wiley, J. F. (2018). MplusAutomation: An R Package for Facilitating Large-Scale Latent Variable Analyses in Mplus. Structural equation modeling: a multidisciplinary journal, 25(4), 621-638.
Ingels, S. J., Pratt, D. J., Herget, D. R., Burns, L. J., Dever, J. A., Ottem, R., … & Leinwand, S. (2011). High School Longitudinal Study of 2009 (HSLS: 09): Base-Year Data File Documentation. NCES 2011-328. National Center for Education Statistics.
Muthén, B. O., Muthén, L. K., & Asparouhov, T. (2017). Regression and mediation analysis using Mplus. Los Angeles, CA: Muthén & Muthén.
Muthén, L.K. and Muthén, B.O. (1998-2017). Mplus User’s Guide. Eighth Edition. Los Angeles, CA: Muthén & Muthén
R Core Team (2017). R: A language and environment for statistical computing. R Foundation for Statistical Computing, Vienna, Austria. URL http://www.R-project.org/
Tingley, D., Yamamoto, T., Hirose, K., Keele, L., & Imai, K. (2014). Mediation: R package for causal mediation analysis.
Vinokur AD, Price RH, Schul Y (1995). Impact of the JOBS Intervention on Unemployed Workers Varying in Risk for Depression. American Journal of Community Psychology, 23(1), 39–74.
Wickham et al., (2019). Welcome to the tidyverse. Journal of Open Source Software, 4(43), 1686, https://doi.org/10.21105/joss.01686
